Designing ballots – an experiment in form layout

Documents and other tools that the public interacts with are a kind of performance support; the goal is to help people accomplish things they want or need to do. Job aids are one form of performance support, and I see a ballot as a kind of collector worksheet (as opposed to one that helps calculate): information on the ballot form is organized, typically by office or issue, and the voter has a way to indicate her selection.

The Center for Civic Design has for its goal making “every interaction between government and citizens easy, effective, and pleasant.” I’ve just come across a post of theirs from 2008 that discusses in depth a usability test for state ballots in New Hampshire.

The test looked at a single question: is it better to left-align the names of candidates, or to right-align them so each name is as close as possible to the circle that the voter would fill in?

Examples of two layouts for a ballot. On Ballot A, names are left-aligned. On Ballot B, names are right-aligned so as to be close to the circle that a voter would fill in.
Examples of the two ballot formats, from the CCD’s usability test report.

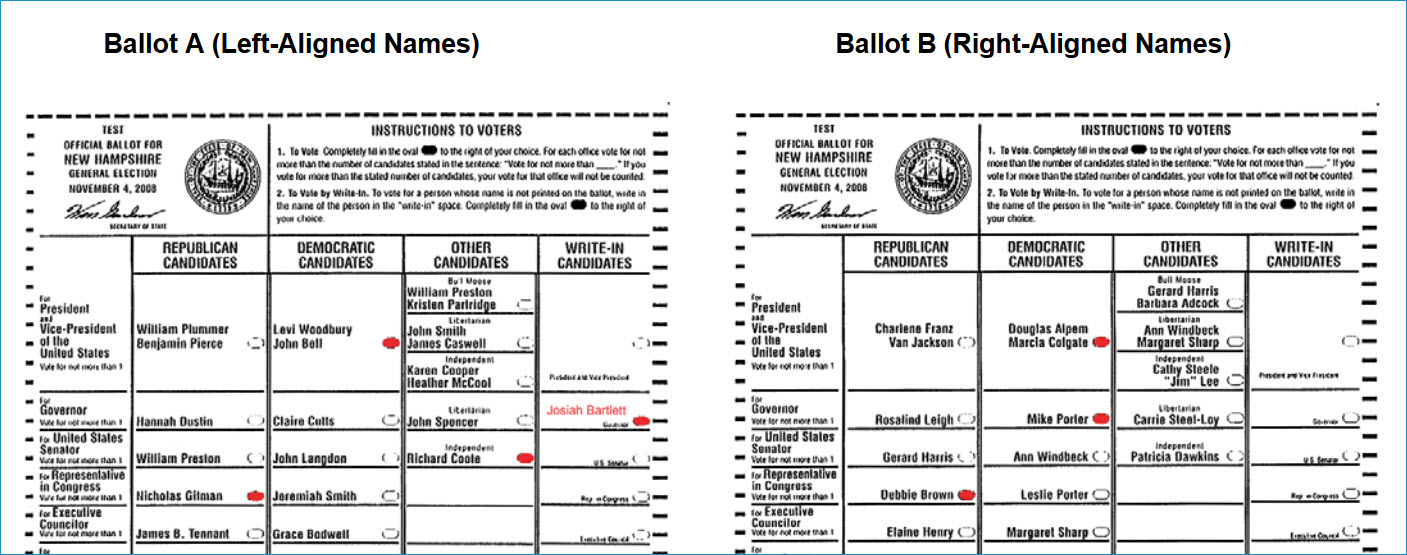
From a performance improvement viewpoint, and as someone who’s worked as an election judge several times, I found the discussion in the full report enlightening. As for the conclusions, participants in the test who used Ballot B:

  • Took slightly less time to vote.
  • Made fewer errors.
  • Preferred Ballot B to Ballot A.

From CCD’s conclusions:

Although the difference in the number of errors made by participants when voting on Ballot A and Ballot B is not statistically significant, the data indicate that there is a trend toward fewer errors when voting on Ballot B. For this reason, we recommend the use of Ballot B (right-aligned names) for the general election in November.
A strong proximity relationship between candidate names and fill-in ovals is more important than the alignment of names on the ballot.

Income-based repayment calculator for student loans

About this job aid

The Office of Federal Student Aid is part of the U.S. Office of Education. Part of its mission is to inform students and families about federal student aid programs.

Students with certain federal loans who are experiencing financial hardships may be eligible for the Income-Based Repayment plan. An IBR can lower the required monthly payment, though it can extend the payment period and thus increase the total interest paid.

As part of its information about load replayment, the Office of Federal Student Aid has an online calculator to determine the likely monthly payment under an IBR.

The IBR calculator
The IBR calculator

This is a calculator job aid–based on information entered, it performs calculations and produces an answer. In this case, the answer is an estimated loan payment.

What’s the accomplishment?

Determining the monthly payment for a student load under an Income-Based Repayment plan.

Who uses this job aid?

Anyone trying to determine this figure; most likely someone with a student loan who’s having trouble making the payments.

Using the calculator

Preliminary information:

There are many kinds of student loans, and not all are eligible for an IBR plan. On the same page as the calculator, Federal Student Aid states:

Your loan servicer will determine your eligibility for IBR, but check this calculator to see whether you might qualify and what your estimated payment could be.

In addition, there’s a link to the National Student Loan Data System so that a person with a student loan can determine which type of loans he has, along with the current amount of principle and interest.

Finally, the page suggests having on hand income information like your most recent federal income tax return.

The calculations:

As the first step, I entered marital status, family size, and location, using an example in the FSA FAQs (single, living alone, in Maryland).

Single, living alone, not in AL or HI

Next, I enter details about my current loans:

Current loans
Current loans

After that, I enter income data based on my (hypothetical) tax return.

Income data
Income data

Based on the data I provided, the calculator says I may qualify for a monthly payment of $309.

The calculator then provides information about the next part of the process:

Next steps
Next steps


Comments / critique

Adaptive approach

When you see the calculator, it looks like the first image in this post: just the space for marital status, family size, and location. Only after you enter that data does it expand to ask for income data, and only after you enter that data does information appear for the estimated monthly payment and for the next steps to take.

Considering the complexity of the subject, that’s a good approach for the calculator to take. It’s less intimidating at the outset.

Embedded help–less than helpful?

I did find it a little confusing to read “I owe [amount] in federal student loans” and “I originally borrowed [amount] in federal student loans.” When I clicked the icon for more information, at first I thought I had a problem with my browser. It took me a while to realize the information appeared further down the screen than I expected:

Help's down there
Help’s down there

That image is 570 pixels high, and on some computers might not be obvious.

Other resources

Construction summary worksheet for new-housing tax rebate

Here’s an example of a lengthy job aid: Canada Revenue’s form  GST191-WS, the Construction Summary Worksheet.

Who uses this job aid?

Canada Revenue has a process through which which certain homeowners can claim tax rebates for new construction, substantial renovation, and similar activity. Claims for owner-built homes (as opposed to homes purchased from a builder) use form GST 191. In order to submit the claim, the homeowner needs to complete this worksheet.

What’s this job aid for?

To receive a tax rebate, the applicant needs to document facts about the project, including the location of the construction, the construction period, and the fair market value of the property at the end of the project. In addition, the worksheet has six pages for documenting the various vendors, invoices, amounts paid, and amounts of GST (goods and services tax) paid.

Here’s page 2 as a sample. (Or, view the entire worksheet from the Revenue Canada site.)

Page two of Revenue Canada form GST 191 WS
(Click to enlarge this sample.)

Most projects, of course, will not have all of the 90-odd items listed (like flooring, built-in appliances, septic system, and land purchase). As a job aid, the worksheet is supporting two kinds of tasks: it prompts the applicant to consider an extensive list of possible expenses, and it guides the application through the processes needed to complete the actual application.

That’s why the final section of the GST191-WS worksheet includes a number of calculations based on data in the preceding seven pages: there are six important totals that the applicant will transfer to GST 191, the rebate application.

Section D from Canada Revenue form GST 191 WS
(Click to enlarge this sample.)

Comments

I haven’t read the instructions (which a sensible applicant would do), but I found some of the guidance in Section D confusing.  I think it’s because the section uses digits to refer both to particular boxes (fields) for information, and for page numbers, and for labels within the section.

As an example, see the circled information:

After I enter the amount from box 4 on page 7, what do I do? Multiply it by the amount in box 5? Or multiply it by 5?

And then do I add the amount in box 12, or simply add 12?

I think in both cases the answer is “the amount in the box,” but the worksheet could say so explicitly:

Total amount in box 4 on page 7: ____
Multiply that answer by the amount in box 5: ____
Divide that answer by the amount in box 12: ____

That number 1, on the right, is apparently a label for this calculation–or for the result of this calculation. You can see in the sample of Section D that there are similar labels for the next two calculations, followed by the instruction to add the three together.

This part of the worksheet has nearly half a page of blank space. It’d be a good idea to test two versions of this summary on typical performers to see if clearly labeling helps to reduce errors.

The Scrooge-O-Meter

The Scrooge-O-Meter from LSS Financial Counseling Service is an example of a calculator job aid.  Calculators guide someone through a task by prompting for numerical values and performing calculations. The idea is to help a person reach some conclusion without having to master the factors or the math involved.

The Scrooge-O-Meter

(LSS Financial Counseling Service is part of the work of Lutheran Social Service of Minnesota.)

Who uses this job aid?

Most likely someone trying to learn the added financial burden of buying on credit.  (See additional thoughts from the group that created it, later in this post.)

What is the task supported?

I would say “awareness” or even “empowerment.”  The goal is to help someone understand the additional cost of purchasing on credit.  I filled in the numbers you see in this example.  The result says to me that “spreading out” credit payments for my holiday buying makes those purchases nearly 10% more expensive than I’d thought.

Notice that it doesn’t render judgment (“$68.72 extra?  Are you nuts?!?”).  The job aid simplifies the process so I can more readily see and understand the impact of buying on credit.  I’m free to make my own decisions about what to do next.

More about the Scrooge-O-Meter

LSS Financial Counseling Service wants consumers to know that they can turn to a national network of nonprofit financial counseling and debt management (FCS is a member of that network).  The page with the Scrooge-O-Meter offers a toll-free number, online counseling, a newsletter, and other resources.

Darryl Dahlheimer, program director of LSS Financial Counseling Service, was kind enough agree to its appearing here and also to provide these details:

There are many tools to help consumers calculate credit card repayment, but here are three reasons we like this one:

  1. It sets a playful tone, to overcome the shame/intimidation of finances for so many who feel “dumb about money” but want to learn.
  2. It helps make the true cost of using credit visible.  Plug in an example of buying that $500 iPad at a major store on their 21% interest credit card and then paying only the $15 minimum each month. You will pay a whopping $757 and take over four years to pay off.
  3. Conversely, it allows you to see the tangible benefits of paying more than minimums.

(Based on Job aid: the Scrooge-O-Meter
originally published on Dave’s Whiteboard.)